


Cisco’s latest version of their Virtual Networking Index (VNI) was released on February 18th and we wanted to discuss some of the key points. As is often the case with equipment vendors it is important to take forward-looking projections with some caution, therefore we will focus mainly on last year’s facts.
Global mobile data
Cisco states that Global mobile data traffic grew an astonishing 71% in 2017. Global mobile data traffic reached 11.5 exabytes per month at the end of 2017, up from 6.7 exabytes per month at the end of 2016. (1 exabyte is equivalent to 1 billion gigabytes.) The growth trend for mobile data continues with mobile data traffic growing 17-fold over the past 5 years.
Growth rates varied quite significantly by region, with the Middle East and Africa having the highest growth rate (92%) followed by Asia Pacific (86%), Latin America (68%), and Central and Eastern Europe (66%). Western Europe grew by an estimated 60%, and North America trailed Western Europe at 23% growth in 2017. North America didn’t show significant growth despite the widespread advent of unlimited plans.
Mobile Data Traffic
Figure 1. Mobile Data Traffic Growth in 2017
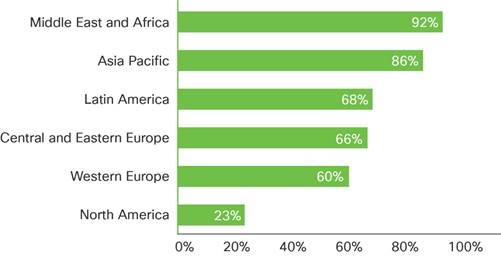
Source: Cisco VNI Mobile, 2019
Most interestingly 4G traffic accounted for 72% of mobile traffic in 2017. Although 4G connections represented only 35% of mobile connections in 2017. In 2017, a 4G connection generated nearly 3 times more traffic on average than a 3G connection.
Global Mobile Traffic by Connection Type
Figure 13. Global Mobile Traffic by Connection Type
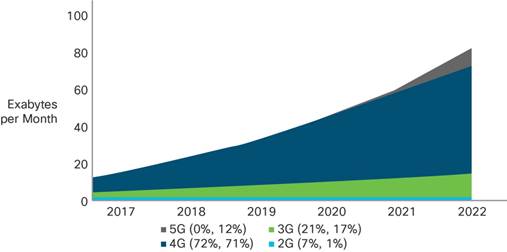
Note: Figures in parentheses refer to 2017, and 2022 mobile traffic share by network type.
Source: Cisco VNI Mobile, 2019
Globally, smart devices represented 53% of the total mobile devices and connections in 2017; they accounted for 92% of the mobile data traffic. (For this study, “smart devices” refers to mobile connections that have advanced multimedia/computing capabilities with a minimum of 3G connectivity.) In 2017, on average, a smart device generated 10 times more traffic than a nonsmart device. Showing the impact that smartphones and in particular data-hungry mobile apps are having on network consumption.
Mobile video traffic accounted for 59% of total mobile data traffic in 2017. Mobile video traffic now accounts for more than half of all mobile data traffic.
The top 1% of mobile data subscribers generated 6% of mobile data traffic, down from 52% in 2010. The top 20% of mobile users generated 62% of mobile data traffic. This shows that network consumption is now more spread across the base and it is no longer the power users that are consuming the majority of network capacity.
Top Mobile User Profiles
Figure 27. Top 20% Consumes Nearly 62% of Mobile Data Traffic
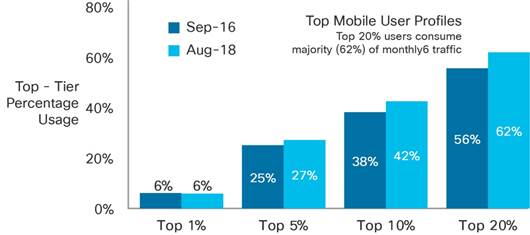
Source: Cisco VNI Mobile, 2019
Average smartphone usage grew by 49% in 2017. The average amount of traffic per smartphone in 2017 was 2.3 GB per month, up from 1.6 GB per month in 2016.
Conclusion
In summary, it’s clear that data consumption continues to explode and shows no sign of slowing as 4G and smartphones increase penetration. It appears that the operators can only increase capacity just in time to have it consumed by new data-hungry apps. Of particular challenge for operators is how to monetise OTT video streaming which now constitutes over half of all mobile data traffic but which operators share very little in the revenue pie. This challenge is only set to compound with the introduction of more data-hungry Augmented and Virtual reality services. The theme continues that operators will need to find and implement a multitude of capacity planning techniques including WiFi offload, densification and spectrum optimization to name a few.